Tuesday, July 2, 2024 04:29 PM

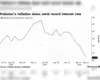
Traders cautioned on RSI signals for market sentiment
- RSI indicates neutral market stance around 50 level
- Overbought zone warning if RSI surpasses 70
- RSI essential for monitoring market momentum and reversals
 Image Credits: tribune.com.pk
Learn about the Relative Strength Index (RSI) and its significance in analyzing market momentum and potential reversals. Understand how RSI levels can guide traders in making informed decisions and adjusting positions in response to changing market sentiment.
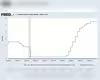
The Relative Strength Index (RSI) is a popular technical indicator used by traders to analyze the momentum of a stock or asset. It measures the speed and change of price movements, indicating whether a security is overbought or oversold. The RSI is calculated based on the average gains and losses over a specified period, typically 14 days.
Currently, the RSI is hovering around the midpoint level of 50, suggesting a neutral stance in the market. This indicates that the price is neither overbought nor oversold, signaling a balanced market sentiment. However, traders should be cautious as a significant price increase could push the RSI above 70, entering the overbought zone. This could potentially lead to a reversal in market sentiment, prompting traders to consider adjusting their positions accordingly.
Understanding the Relative Strength Index is crucial for traders looking to make informed decisions in the market. By keeping an eye on the RSI levels, traders can gauge the momentum and potential reversals in market trends. Remember, while the RSI provides valuable insights, it should be used in conjunction with other technical analysis tools for a comprehensive trading strategy.